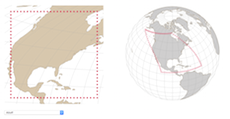
Visualizing Map Distortion
visualizing map distortion. GitHub Gist: instantly share code, notes, and snippets.
From Awesome Explorables
Something new washes up every time: pages from all kinds of people, made with all kinds of tools. Beachcomb shows you what it found, then gets out of the way.
Pick a few topicsvisualizing map distortion. GitHub Gist: instantly share code, notes, and snippets.
From Awesome Explorables
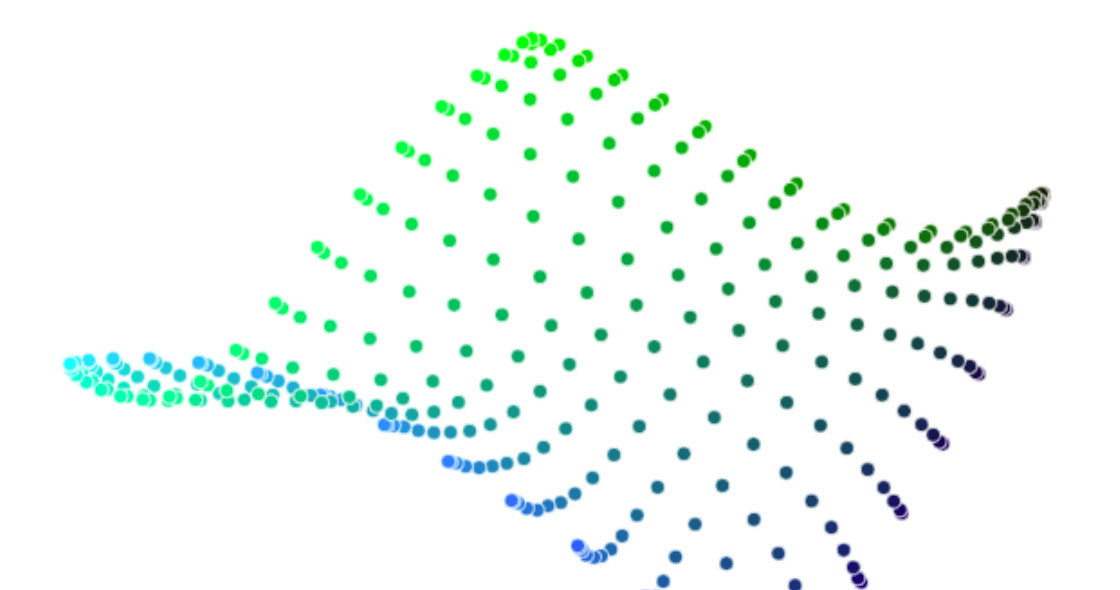

a data-based game about educational & residential segregation
From Explorable Explanations
From Awesome Explorables

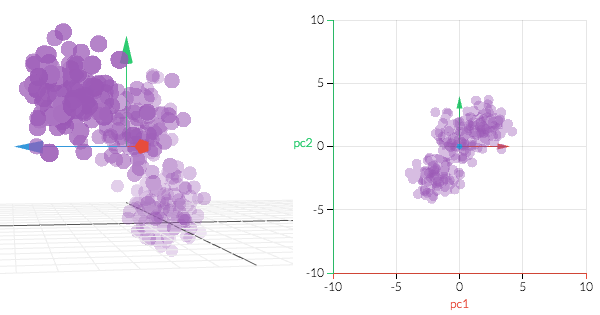
Tracking 1,000+ people through the ups and downs of their relationships.
Something different
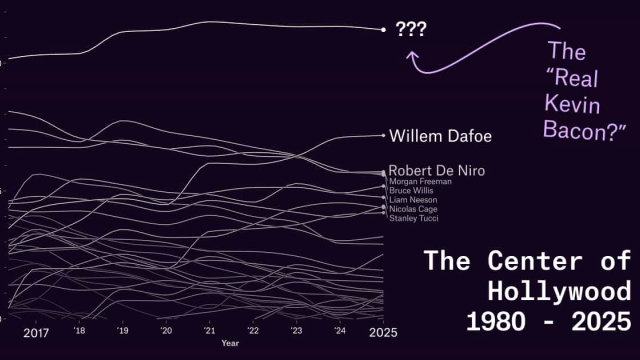
Demystifying the 6 degrees of Kevin Bacon: the past, present, and future center of Hollywood.
From The Pudding

From Awesome Explorables
Great illustration of survival analysis, and of probabalistic proccesses in general.
Something different
“a useful statistical tool with an intimidating name”
From Explorable Explanations
why outbreaks like coronavirus spread exponentially, and how to “flatten the curve”
Something different
a visualization of the infamous WWII encryption device
From Explorable Explanations
the 2011 essay that coined the phrase 'Explorable Explanation'
From Explorable Explanations

Hamiltonian monte carlo explained.
From Awesome Explorables
a graphics editor & programming environment for interactive diagrams
From Explorable Explanations
Explore data and build apps seamlessly with marimo, a next-generation Python notebook.
Something different

a morbid simulation using your info + CDC data
Something different

a systemic guide to interactive visualization
From Explorable Explanations
That's this stretch.
Walk on